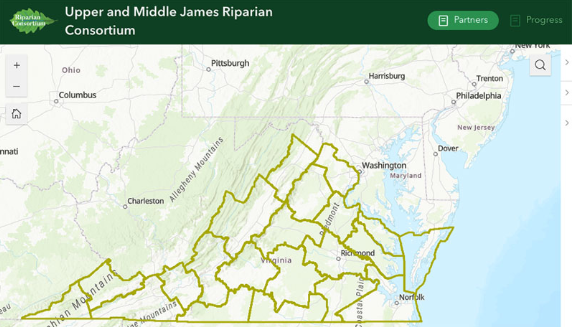
Partner Tool Overview: Enhancing Collaboration Across the Consortium
By Michael Gillert, James River Association
The James River watershed spans a 10,000 square mile area from the Allegheny Highlands to the Chesapeake Bay, presenting unique challenges and opportunities that require coordination from numerous agencies and organizations. The Partner Tool consolidates many different pieces of information into an accessible and intuitive user interface, allowing the many different Consortium partners to work from a shared knowledge base. By providing a single platform for viewing data, the tool enhances consistency and facilitates a closer alignment of goals across the many different partners belonging to the Consortium.
This Partner Tool can be utilized to assist in answering questions such as:
- What organizations are working in overlapping areas and what potential partnerships could be formed where overlapping geographies and goals align?
- What areas would most benefit from buffer planting or restoration by looking at overlaps in community and environmental needs?
- What is the Watershed Implementation Plan (WIP) progress of buffer implementation over the past five years in each county?
Data layers within the Partner Tool are separated into four categories: Partners, Reference, Priorities, and Progress. These layers include partner organization geographies, watershed and county boundaries, and priority areas for restoration. Users can also view progress made in buffers planted by acres based on data from the Chesapeake Bay Program’s Chesapeake Assessment Scenario Tool (CAST). Buffer acreage is visualized in forested buffer acres planted and maintained over the past five years at county, HUC10, and HUC12 geographies, with the County-level geographies being the most accurate overall according to CAST modeling.
Navigating the Partner Tool:
- Users can select data layers by interacting with the checkboxes to the left of the layer names.
- Group layers can be expanded to show individual sublayers, which must be checked to be visible.
- Once layers are visible, how the data is represented symbolically will appear in the legend at the bottom left corner of the map.
- Interactive map features provide additional details—clicking on the map triggers popups with information from visible layers, while arrow buttons on the pop-up box header allow navigation between multiple active layer popups.
- Transparency adjustments can be made through the three-dot menu on the layer list, enabling users to visually adjust each layer’s data and view multiple geographies and datasets simultaneously.
By streamlining access to relevant data, the Partner Tool simplifies planning and enhances collaborative work across the James River watershed. This resource aids partners in understanding the landscape, leveraging resources efficiently, and building a unified approach to riparian buffer restoration. The development of tools like this underscores the importance of turning data into actionable insights, fostering stronger partnerships, and supporting the collective mission of improving water quality in the James River watershed and Chesapeake Bay.

